
Finance, Reports & Cash Forecast
Bank reconciliation, expenses, multi-currency P&L, 90-day cash forecast, and supplier-price-drift detection.
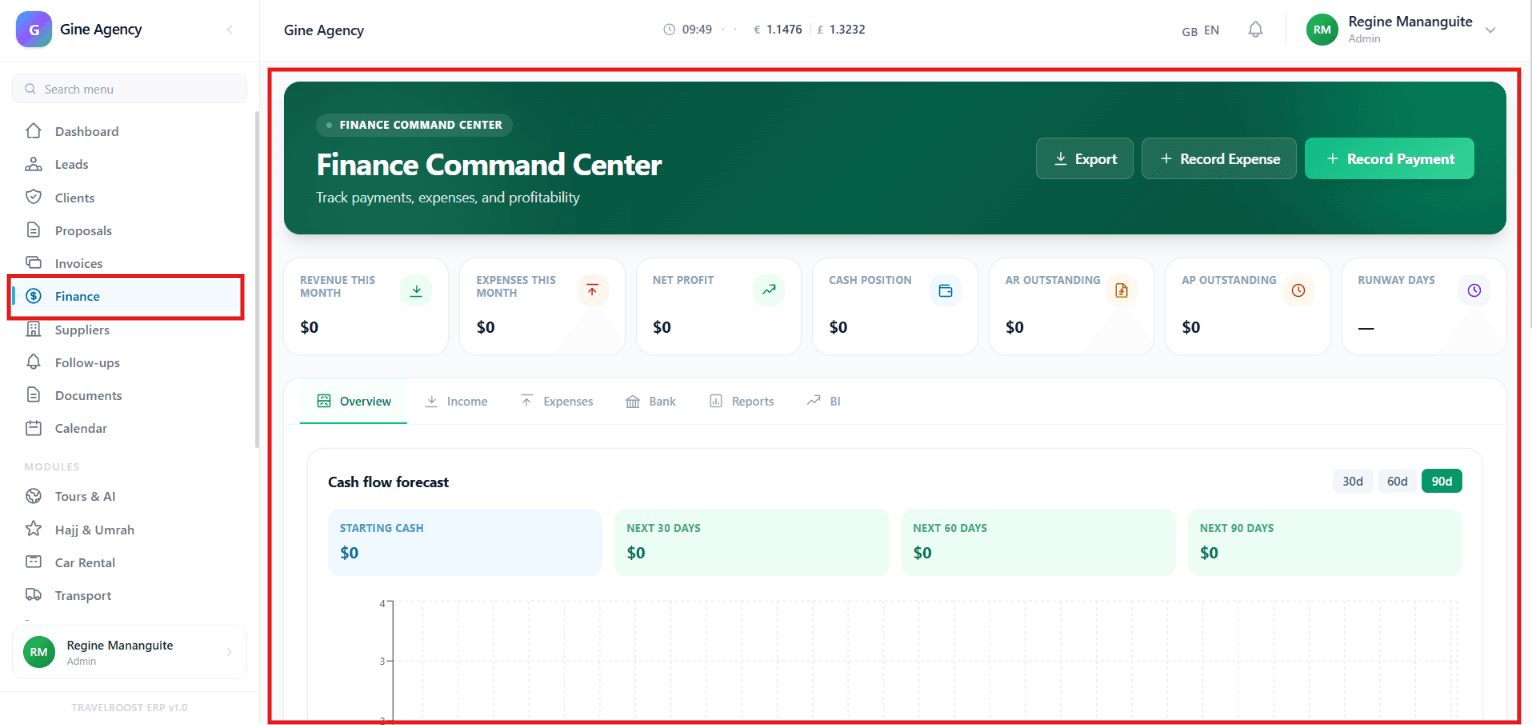
The Finance Command Center provides a complete overview of your business's financial health. It helps you track income, expenses, cash flow, outstanding payments, and profitability in one centralised dashboard — the single screen every agency owner should open first thing every morning.
Importance
The Finance Command Center is essential for maintaining financial stability and making informed business decisions. It provides real-time visibility into your company's financial performance, allowing you to monitor revenue, control expenses, manage cash flow, and identify financial risks before they become major issues. By keeping all financial information in one place, businesses can improve budgeting, planning, and overall financial management.
Benefits
Using the Finance Command Center helps you:
- Monitor your business's financial performance in real time
- Track income, expenses, and profitability from one dashboard
- Maintain healthy cash flow by monitoring receivables and payables
- Make informed financial decisions using reports and analytics
- Forecast future cash availability for better budgeting and planning
- Quickly identify spending trends and areas where costs can be reduced
- Keep financial records organised for reporting, audits, and business growth
What You'll See on This Page

- Revenue This Month — Total income generated during the current month
- Expenses This Month — Total expenses recorded during the current month
- Net Profit — The difference between revenue and expenses (your actual profit)
- Cash Position — Current available cash balance
- AR Outstanding — Outstanding Accounts Receivable (money customers still owe you)
- AP Outstanding — Outstanding Accounts Payable (money you owe suppliers or vendors)
- Runway Days — Estimated number of days the business can continue operating based on current cash reserves
Why these seven numbers matter
Every agency owner should be able to recite these seven numbers without checking. Revenue and Expenses set the direction. Net Profit is whether you're actually making money this month. Cash Position is what's in the bank right now. AR Outstanding is the money you've earned but haven't collected. AP Outstanding is what you owe. Runway Days is the panic button — when it shrinks, act before you run out.
Quick Actions

- Export — Download financial reports and data (CSV / PDF / Excel)
- + Record Expense — Add a new business expense
- + Record Payment — Record a customer payment or incoming transaction
Recording an Expense
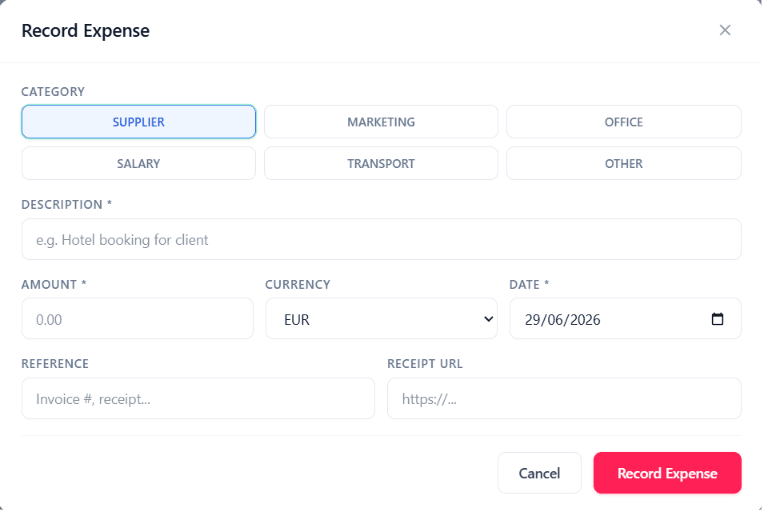
To record an expense, navigate to the + Record Expense button. A Record Expense window will appear where you can enter the expense details.
Complete the following fields:
- Category — Select the category that best matches the expense. Available categories include:
- Supplier — Payments to hotels, airlines, tour operators, etc.
- Marketing — Ad spend, content production, sponsorships
- Office — Rent, utilities, equipment
- Salary — Staff payroll
- Transport — Fuel, vehicle maintenance, fleet costs
- Other — Anything not covered above
- Description (Required) — Enter a brief description of the expense (e.g. Hotel booking for client)
- Amount (Required) — Enter the total expense amount
- Currency — Select the currency used for the expense (e.g. EUR)
- Date (Required) — Choose the date the expense was incurred
- Reference — Enter an invoice number, receipt number, or any other reference related to the expense
- Receipt URL — Paste the URL of the receipt or supporting document, if available
After completing all the required fields, click Record Expense to save. Once the expense has been recorded, it will be added to your expense records and reflected in your financial reports, helping you accurately track business expenses and monitor overall profitability.
Why categorisation matters
A pile of uncategorised expenses tells you nothing. Categorised expenses become a P&L by category, an AI-input for cost-reduction recommendations, and a budgeting baseline. Always categorise — the 5 seconds you spend per expense save hours of reconciliation later.
Recording a Payment
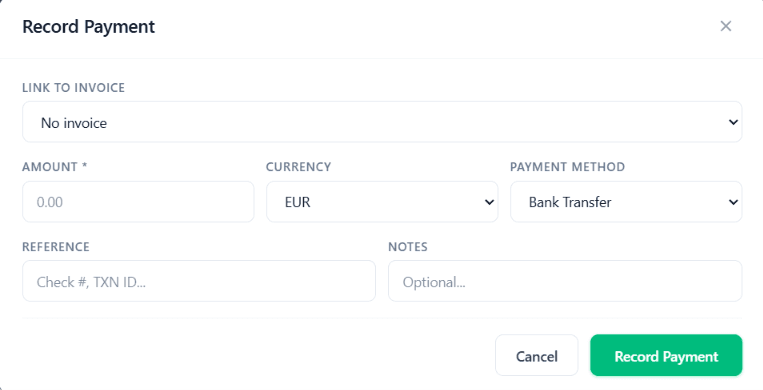
To record a payment, navigate to the Finance section and click the + Record Payment button.
A Record Payment window will appear where you can enter the payment details.
Complete the following fields:
- Link to Invoice — Select an existing invoice if the payment is associated with a specific invoice. If the payment is not linked to an invoice, you can leave it as No invoice.
- Amount (Required) — Enter the amount received
- Currency — Select the currency used for the payment (e.g. EUR)
- Payment Method — Choose the payment method: Bank Transfer, Cash, Credit Card, or another available option
- Reference — Enter a payment reference, such as a check number, transaction ID, or payment confirmation number
- Notes — Add any optional notes related to the payment for future reference
After completing the required fields, click Record Payment to save. Once recorded, the payment will be added to your payment history. If the payment is linked to an invoice, the corresponding invoice will automatically update its Paid Amount, Remaining Balance, and Payment Status to reflect the newly recorded payment.
Navigation Tabs

- Overview — Summary of key financial metrics and performance
- Income — View revenue and income transactions
- Expenses — Track and manage business expenses
- Bank — Monitor bank account transactions and balances
- Reports — Generate financial reports and statements
- BI (Business Intelligence) — Analyse financial trends and performance data
Cash Flow Forecast

The Cash Flow Forecast helps predict future cash availability by showing:
- Starting Cash — Current available cash balance
- Next 30 Days — Expected cash position over the next month
- Next 60 Days — Forecasted cash flow for the next two months
- Next 90 Days — Projected cash flow for the next three months
Why forecasting changes how you run your agency
Without forecasting you reactively cut costs or chase payments when you notice cash is low — usually too late. With forecasting you see in advance that "we'll be tight in February", which lets you act now: collect AR, delay a non-urgent purchase, push a marketing campaign for early bookings.
Financial Charts

- Income vs Expenses (12 Months) — Compare revenue and expenses over the past year
- Cash Position Trend (30 Days) — Monitor how cash balances change over time
- Top Expense Categories — Identify where most business spending occurs
- Recent Activity — View the latest financial transactions and updates
Business Intelligence (BI) — Finance Analytics Dashboard

The Business Intelligence (BI) dashboard is one of the most powerful features in the Finance module of TravelBoost. It transforms raw transaction data into strategic insight, letting you ask "where is the money going?" and get an answer instead of a spreadsheet.
Importance
The BI Dashboard helps business owners and finance teams understand their financial performance at a glance. It highlights revenue trends, spending patterns, cash flow risk, and customer/supplier concentration — the patterns that separate growing agencies from stagnating ones.
Benefits
Using the Business Intelligence Dashboard allows you to:
- Monitor your business's financial health in real time
- Understand spending patterns and control operating costs
- Track cash flow and estimate how long your business can continue operating with available funds
- Identify your highest-value customers and suppliers
- Detect financial trends before they become problems
- Make smarter budgeting and investment decisions using visual reports
- Save time by accessing key financial insights in one centralised dashboard
What You'll See on This Dashboard
Burn Rate & Runway

This section shows how quickly your business is spending money and how long your available cash can sustain operations.
| Metric | Meaning |
|---|---|
| Runway (Months) | Estimated number of months your business can continue operating with its current cash reserves |
| Monthly Burn Rate | The average amount of money your business spends each month |
| Current Cash Position | The total cash currently available |
| AR / AP Net | Net difference between Accounts Receivable (money customers owe you) and Accounts Payable (money you owe suppliers) |
Why it matters: This helps you understand whether your business has enough cash to support future operations and whether adjustments are needed.
Burn & Cash Trend (6 Months)

This interactive chart compares:
- Monthly Burn Rate (red line)
- Net Cash Flow (green line)
By hovering over the chart, you can view financial data for each month.
Benefit: Easily identify whether your cash flow is improving or declining and spot financial trends over time.
Top Customers

This section highlights the customers who generate the most revenue for your business.
It displays:
- Customer names
- Total revenue generated
- Growth percentage
- Performance ranking
Benefit: Helps you recognise your most valuable customers, strengthen relationships, and focus on high-performing accounts. Use this for VIP tier promotion, birthday outreach, and exclusive trip offers.
Top Suppliers

This panel displays suppliers based on spending or transaction activity.
Benefit: Allows you to monitor supplier expenses, evaluate vendor performance, and identify your biggest purchasing partners. The right place to start when negotiating volume discounts.
AI Cost-Reduction Recommendations

The AI Cost-Reduction Recommendations panel analyses your financial data and identifies opportunities to reduce operating costs.
The BI dashboard uses AI to analyse your business expenses and automatically recommend ways to reduce costs.
Examples include:
- Consolidating suppliers (negotiate volume discounts when you spread spend across too many)
- Negotiating better service rates (when market rates have dropped below your contracted rate)
- Implementing expense policies (when categories show outlier spending)
- Reviewing recurring operational costs (subscriptions you forgot about)
Each recommendation includes:
| Field | Meaning |
|---|---|
| Priority level | High, Medium, or Low — how impactful this change is |
| Estimated percentage of potential savings | Concrete number, e.g. "save 12% on supplier spend" |
| A detailed explanation | Why the AI made this recommendation |
| Expense category | Which part of your business this affects |
Benefit: Instead of manually searching for cost-saving opportunities, the system proactively identifies areas where your business can save money — backed by data from your own transactions.
AI Budget Suggestions

TravelBoost also provides AI-generated budget recommendations for different expense categories, such as:
- Travel
- Marketing
- Office Expenses
- Meals
- Transportation
The recommendations are based on:
- Historical spending patterns
- Average monthly expenses
- Industry benchmarks for travel agencies of your size
- Your current cash position and runway

How to use AI budgets
- Open AI Budget Suggestions
The panel surfaces a recommended monthly budget for each expense category based on your last 12 months of activity.
- Accept or modify
You can accept the recommendation as-is, or adjust it. Once set, the budget becomes a tracking target.
- Get alerts
The system notifies you when actual spend in a category approaches the budget (default: 80% threshold) so you can pause before overrunning.
- Review monthly
At month-end, the system reports actual vs. budgeted spend per category — your variance report, automatically.

Frequently asked questions
What's the difference between Cash Position and Runway Days?
Cash Position is the amount of cash you have right now. Runway Days estimates how many days you can keep operating at your current burn rate (expenses minus revenue). A growing Cash Position with shrinking Runway Days means your costs are growing faster than revenue — early warning sign.
How accurate is the Cash Flow Forecast?
It uses confirmed inflows (paid invoices), expected inflows (sent proposals × historical acceptance rate), confirmed outflows (open payables with due dates), and recurring expenses. Most agencies report 85–95% accuracy at the 30-day horizon, dropping to 70–80% at 90 days.
Can I export financial data for my accountant?
Yes — Export generates a ZIP of CSV files (income, expenses, invoices, payments, P&L by period). Standard accounting tools (Xero, QuickBooks, Sage) can also receive direct nightly sync via integration.
What does the AI Cost-Reduction panel actually do?
It analyses your supplier spend, expense patterns, and contract terms to surface opportunities: consolidate suppliers (negotiate volume discounts), renegotiate rates (when market drops below your contracted rate), eliminate redundant subscriptions, etc. Each recommendation includes estimated savings and an explanation.
Are AI Budget Suggestions binding?
No — they're recommendations based on your historical spending. You can accept, modify, or ignore. If accepted, the suggested budget becomes a tracking target and you get alerts when expenses approach it.