
Reports — Business Intelligence & Analytics
Health score, revenue, profit, margins, conversion funnels, agent performance, P&L summary, A/R aging, and AI insights.
The Reports section provides a complete overview of your agency's performance by displaying key business metrics, financial data, sales funnels, and operational insights. It transforms raw transactional data into the strategic picture an agency owner needs to make confident decisions.
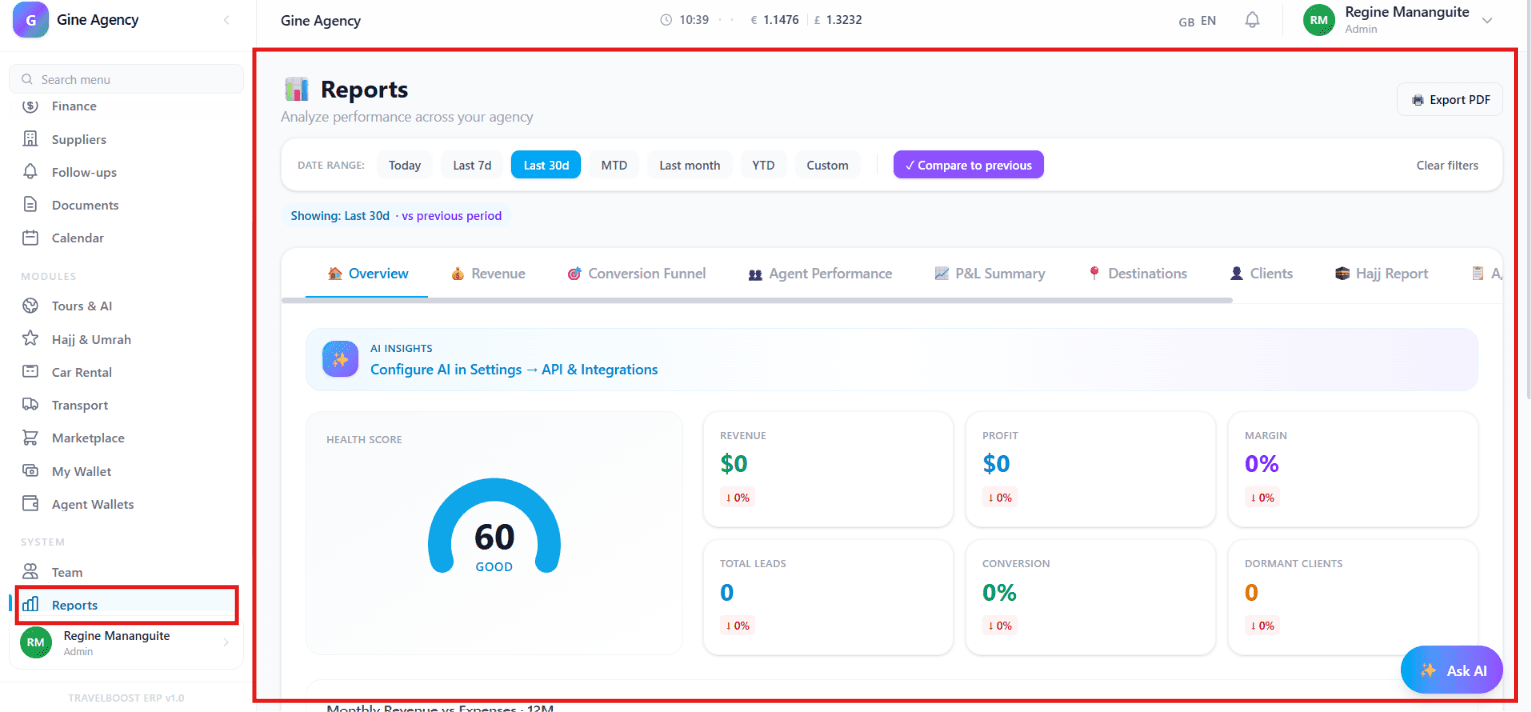
What You'll See on This Page
- Health Score — An overall performance rating based on business activity and system usage
- Revenue — Total income generated during the selected reporting period
- Profit — Net earnings after expenses have been deducted
- Margin — Profitability percentage based on revenue and expenses
- Total Leads — Number of leads generated during the selected period
- Conversion — Percentage of leads converted into customers
- Dormant Clients — Clients who have not engaged or made transactions recently
Why these numbers matter for your agency
Health Score is the executive summary — if it's up month-on-month, you're on track. Revenue tells you size; Margin tells you quality. Conversion below 15% means sales has a problem; below 10% means a serious problem. Dormant Clients are your re-engagement goldmine — they already trust you, you just need to remind them you exist.
Date Range Filters
You can customise report data using different time periods:
| Filter | Use case |
|---|---|
| Today | View today's performance |
| Last 7 Days | Analyse activity from the past week |
| Last 30 Days | Review performance over the past month |
| MTD (Month-to-Date) | View data from the beginning of the current month until today |
| Last Month | Compare performance from the previous month |
| YTD (Year-to-Date) | Analyse performance from the start of the year |
| Custom | Select a specific date range |
| Compare to Previous | Compare current results against a previous period |
When to use which
For monthly reviews use Last Month with Compare to Previous toggle on. For mid-month course corrections use MTD. For board presentations use YTD with Compare to Previous Year.
Report Categories
The Reports section includes multiple analytics tabs:
- Overview — High-level summary of business performance
- Revenue — Detailed income and earnings reports
- Conversion Funnel — Track lead progression through the sales process
- Agent Performance — Measure productivity and results of team members
- P&L Summary — Review profit and loss information
- Destinations — Analyse bookings or sales by destination
- Clients — Review client-related performance metrics
- Hajj Report — Monitor Hajj-related bookings and activities
- A/R Aging — Track outstanding receivables and overdue payments
- Source ROI — Measure return on investment from marketing and lead sources
- Settings — Configure reporting preferences and integrations
How to use the key reports
- Start with Overview
Get the executive summary — health score, revenue, profit, margin, conversion. If everything looks green, you're on track. If anything is amber/red, drill into the relevant specific report.
- Drill into Conversion Funnel for sales problems
The funnel shows every stage of the customer journey from first inquiry to repeat customer. The biggest drop-off is where you need to invest in process improvement or coaching.
- Use Agent Performance for team coaching
Side-by-side comparison of agents by leads handled, conversion, revenue, response time. Use this for monthly 1:1s — show the agent their numbers, set targets together.
- Run A/R Aging weekly
The older the receivable, the lower the chance you'll collect it. Weekly A/R Aging review surfaces invoices needing follow-up before they become uncollectable.
- Review Source ROI monthly
Which marketing channels and lead sources are profitable? Source ROI shows revenue per dollar spent per channel. Cut sources with low ROI; double down on high-ROI channels.
Charts and Analytics
The reporting dashboard includes visual charts and graphs such as:
- 📈 Revenue Trends
- 📉 Expense Tracking
- 💰 Profit Analysis
- 👥 Lead Performance
- 🎯 Conversion Metrics
- 📊 Monthly Revenue vs. Expenses
These visual reports make it easier to identify growth opportunities and performance trends.
AI Insights and Recommendations
The system may provide:
- AI Insights — Automated suggestions based on business performance
- Recommendations — Actions to improve revenue, conversions, and efficiency
- Integration Alerts — Notifications about missing API connections or configuration settings
Why AI Insights help your agency
Even a sharp agency owner can't watch every metric every day. AI Insights surface the patterns that need your attention now: "your conversion rate in the Qualified → Proposal stage dropped 20% this month — your Tuesday-shift team might need coaching", "your Source ROI for Facebook Ads has been declining for 4 weeks — consider pausing the campaign or testing new creatives", "12 high-value clients haven't booked in 6+ months — time for a re-engagement campaign".
Exporting Reports
You can save and share reports using:
- Export PDF — Download reports in PDF format for presentations, meetings, or record keeping
The PDF preserves the date range, comparison settings, and visual layout — useful for board meetings, investor updates, or your accountant.
Business Intelligence Benefits
Reports help you:
- Monitor overall business health
- Track revenue and profitability
- Measure sales performance
- Evaluate team productivity
- Analyse marketing effectiveness
- Identify opportunities for growth
- Make informed business decisions
Frequently asked questions
What's the Health Score?
A composite 0–100 score combining: revenue growth vs previous period, conversion rate trend, payment-collection timeliness, customer satisfaction, supplier-spend efficiency. A score above 75 is excellent; below 50 needs investigation. Click into it to see which factors are driving the number.
Can I compare two periods?
Yes — Compare to Previous toggles a comparison row in every chart and KPI (e.g. "This Month vs Last Month", "YTD vs Same Period Last Year"). Useful for "are we actually growing?" conversations.
How is Conversion Funnel different from Pipeline Analytics?
Pipeline Analytics (in Leads) is about lead progression through pipeline stages. Conversion Funnel is broader — it tracks the entire customer journey from first inquiry through booked + paid + returning customer. Use it to spot drop-offs across the whole business.
What does A/R Aging tell me?
How long invoices have been outstanding, bucketed (Current, 1-30 days late, 31-60, 61-90, 90+). Concentration in the older buckets is a collection problem — you're carrying receivables that may never arrive.
Can I export reports?
Yes — Export PDF on any report. The PDF preserves the date range, comparison settings, and visual layout. Useful for board meetings, investor updates, or your accountant.